Posts

Camden’s fire response time sees biggest increase

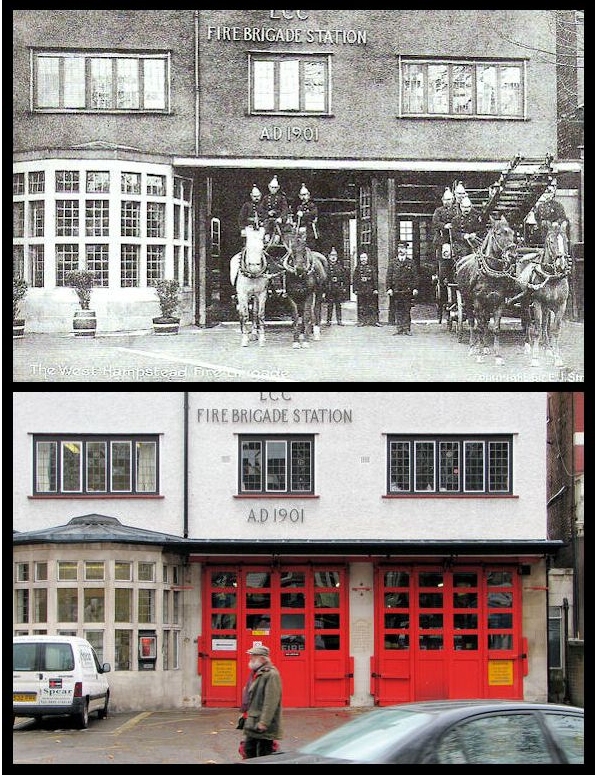
You’ll recall that back in November, Belsize fire station was on a list of likely candidates for closure. West Hampstead station was always safe, even in the drastic 31 station closure model.

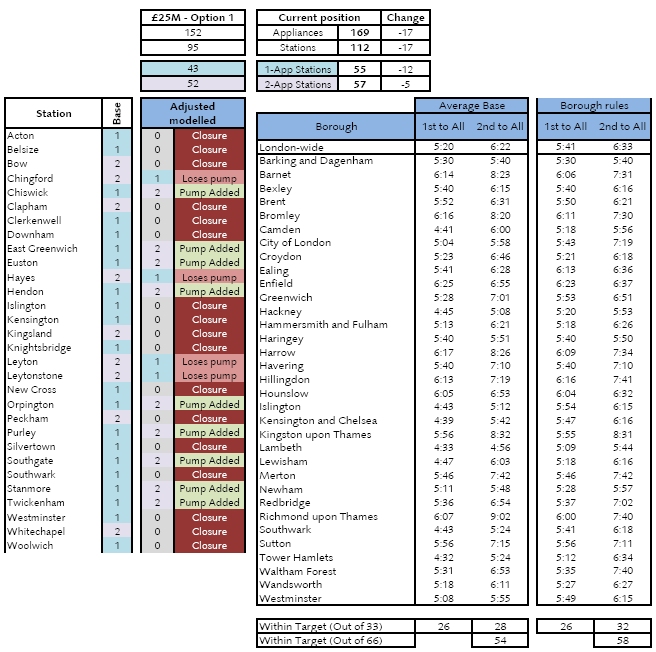
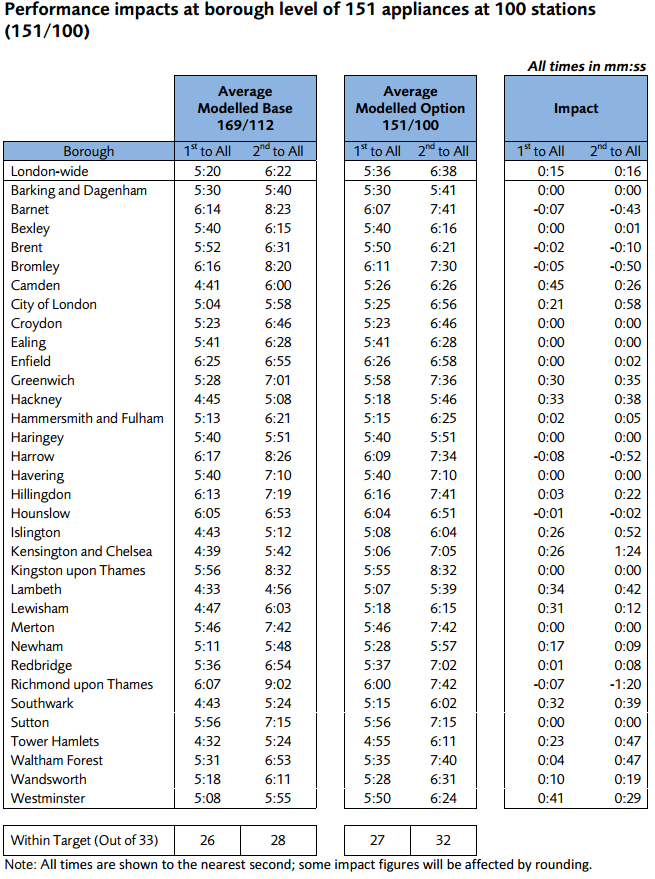
No shock then to see Belsize on the final list of stations to close, announced by the London Fire Brigade (LFB) this week. The surprise is that this list runs to just 12 stations, five fewer than the minimum-impact model published in November. Seven of the remaining 100 stations will lose a fire engine, and four will gain one bringing the total number of appliances down from 169 to 151.

  • Closing: Belsize, Bow, Clapham, Clerkenwell, Downham, Kingsland, Knightbridge, New Cross, Silvertown, Southwark, Westminster and Woolwich.
  • Losing one engine: Chelsea, Chingford, Hayes, Leyton, Leytonstone, Peckham and Whitechapel.
  • Adding a second engine: Hendon, Orpington, Stanmore and Twickenham.
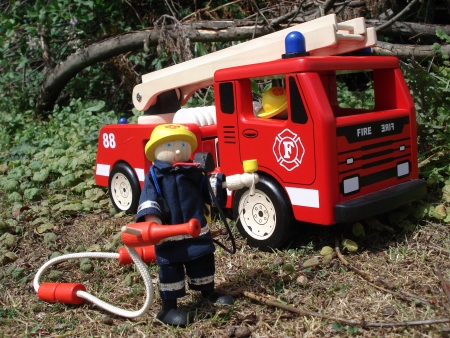
Could this be the fire service of the future?
(c) john-crane.co.uk

In my last article I discussed the impact on response times of the various proposals in some detail. The increase in times in some boroughs seems to have been one of the main reasons behind the decision to close fewer stations (this also means that the LFB still needs to find around £5 million in further savings). The “151/100” option will save £23.5 million and would mean “the deletion” (their words not mine) of 460 station-based posts. If I understand correctly, the remaining £5 million is likely to come from further staff reductions in the years ahead – but this is not clear.

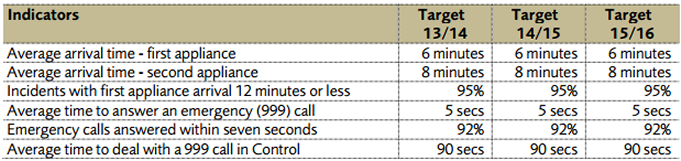
The LFB has decided that it wants to see no change at all to average response times across London.

While one can believe that this might hold true for average times across London, clearly in some locations, it will take longer for a fire engine to get to a fire. As a friend of mine from the US said when I was telling her all this “if your house is on fire, keep some buckets handy”.

The LFB’s report on targets says that while response times need to be looked at at the city level, and it does not organise at the borough level (unlike the police), it understands that the public is concerned about the impact at the neighbourhood level (yeah, no kidding). You can read the (very lengthy) document that explains how this borough-level concern meant that tweaks were made to the model should you wish. Having tried to play down the borough stats, it then cites them to explain how the changes aren’t that bad really (unless you’re in Enfield, which is now half a minute outside the first appliance target).

Camden, as it happens, fares worse than any other borough in terms of increase in first appliance response time, with an increase of 45 seconds. To put this in context, this takes the average response time to 5’26”, still within the 6 minute target, and the 11th fastest in London. The average response time for the second vehicle goes up 26 seconds, the 10th largest increase, to 6’26” – 12th fastest in London down from 10th.

What of these 460 “deleted” jobs? Apparently, the LFB hopes that all of them (!) can be achieved through natural leaver rates and voluntary redundancies. Seems optimistic.

Members of the London Fire and Emergency Planning Authority will discuss the plan on Monday 21 January at 1400. A final decision on the plan is expected to be made at the Authority meeting on 20 June, following a public consultation. Here’s a full list of documents relating to station closures, performance statistics and the number of cats stuck up trees.

My two cents: everyone should want public services to run efficiently and effectively, and reassessing the needs of the population every so often is going to lead to sensible changes in coverage. Nevertheless, the numbers here are clear – response times are going to rise on average in London. Not by much, I accept, and from what is, by national standards, already a fast time. But still, it’s an increase. Obviously, no country has limitless funds and trade-offs between costs and public safety are inevitable – it just seems that the balance is tipping inexorably (and one feels irrevocably) in favour of cost. One also wonders whether as much time is going into the effort to close corporation tax loopholes worth billions as it has in the quest to save £25 million off the fire brigade’s budget.

Video: West End Lane fire

Last night around 4.30pm, smoke was spotted seemingly coming out of the ground outside Sainsbury’s on West End Lane in West Hampstead.

About the same time, a few businesses and residents across the road reported a power cut. Perhaps unsurprisingly it turned out the two were related. Apparently there was a small electrical fire in the cabling that runs under the street (some reports said TV cable), and this was causing smoke to rise quite dramatically from West End Lane.

The fire brigade arrived pretty quickly – not exactly a long way for them – and the fire was extinguished, but it was quite some hours before power was restored to parts of West End Lane.

Wayne Nixon captured some of the drama on video.

Update 4.45pm The Ham & High’s report

Will response times slow under fire station proposals?

West Hampstead police station may be for the chop, but is our fire station safe from the latest round of cuts? The most recent proposal to close stations in London puts Belsize station on the chopping block, while West Hampstead is neither slated for any changes, nor has the security of being on the protected list.

West Hampstead fire station – 111 years old
Photo via @Tetramesh

In October, a leaked document appeared to show that 17 stations were going to be closed in response to the Mayor’s call for the London Fire Brigade (LFB) to find £65 million in savings over two years. The 17 stations included Belsize. This certainly isn’t set in stone, but is believed to be the preferred option. To understand what this means for response times, I’m going to have to show the workings.

The sexily titled Operational efficiency work in progress Fifth London Safety Plan Supporting document No.17 Pre-consultation draft is a 44page discussion of London’s fire station needs published by the LFB. It’s actually very readable and has loads of London-wide statistics. For stats at the borough level, I recommend reading LFB in Camden 2012/13, which shows even more clearly that the number of incidents is falling (it also shows that Camden has the second highest number of false alarms in London). You can even monitor fires at the ward level, and month by month if you really want to dig into the data.

Aside from the financial savings, is there any evidence that the LFB has scope to cut back services? In terms of number of call-outs and looking across London, then yes.

  • The brigade attends 35% fewer incidents than 10 years ago; some stations have seen the number of call-outs drop by two-thirds;
  • 24 fire stations attend two incidents or fewer a day;
  • False alarms make up almost half of all the calls attended;
  • Total number of fires (27,000 in 2011) is lower than at any time in the last 40 years;
  • Fewer people are dying in fires: 56 in 2011 compared to nearly 80 a year between 1991-2001;
  • Even the busiest fire engine (Soho) is occupied for less than 17% of the time;
  • The average firefighter attends 195 incidents a year; of which 101 will be false alarms and only 8 will be the more significant incidents. Some firefighters attend 10 or fewer fires a year

The document points out that although the risk of fast-spreading fires and of domestic deaths and injuries has greatly reduced, it has been replaced by what it terms “new risk”, which is now a very prominent aspect of the Brigade’s work. These new risks (by which I think it means more large-scale incidents) mean that the LFB is much more complex than the old model of stations with one or two fire engines (“appliances” in fire brigade parlance). London hosts a raft of specialist teams such as urban search and rescue teams and high volume pumps.

Of course, one of the reasons that the numbers of fires and fire-related deaths is falling is that fire officers spend more time in the community, making visits to houses and schools. If one thinks of fire crews more like all-round police officers, who have both a community role and an emergency response role, then it is clear that simply looking at the number of times the sirens are wailing through the streets will not paint the whole picture of fire safety in the capital.

What does it cost?
Here are the figures across London:

“We spend around £270m on station-based emergency response. Of that, £229m is spent on firefighters’ salaries and allowances; £21m is spent on the upkeep and running of fire stations; and £20m is spent on equipment, including fire engines.”

Salaries are clearly the big component here, though the document points out that consolidating fire stations can also create substantial savings without reducing coverage. Which brings us to the issue of response times.

Fire! Fire!
London-wide response time targets are:

  • Average arrival time for the 1st appliance: 6 minutes
  • Average arrival time for the 2nd appliance: 8 minutes
  • 95% of incidents must have a 1st appliance arrival time of 12 minutes or less

Camden’s four fire stations perform well against these. In fact, response times are among the fastest in London at just over 4 minutes 40 seconds on average for the first appliance and 6 minutes for the second. There isn’t much doubt that arriving quickly is important when it comes to a serious incident. However, the report says that there are complexities in balancing the desire for speed with the the fact that demand is extremely low in some parts of London.

To determine whether there could be a better and more cost-effective configuration, modelling was carried out based on finding £25m and £50m in savings. Several configurations for each were modelled. The report goes into a lot of detail on this, so do read it if you’re interested.

The option that was leaked back in October is shown below (you’ll need to click for the full-size version):

In terms of the impact on Camden, the two £25m options published both propose closing Belsize and adding an extra pump at Euston. In this scenario, average borough response times drop for the first appliance but are the same or faster for the second vehicle. All are still within the London-wide targets.

In the first of the £50m saving options, Belsize closes, Kentish Town loses an appliance, while Euston and West Hampstead remain unchanged. Appliance one now arrives in 6’00” and Appliance 2 at 7’03”. A marked increase in response time.

The second of the £50m options actually mirrors the £25m options, at least in Camden; i.e., Belsize closes, Euston gets an extra pump, and Kentish Town and West Hampstead remain unchanged. Other changes outside the borough mean response times for both appliances are now effectively the same at 5’57” and 6’00” respectively.

These are all just proposals, although Belsize gets closed in all of them.